Share this
Your data is ready. Your reports should drive decisions.
Join 3,000+ companies using Zebra BI as their decision layer on top of the Microsoft stack. In 45 minutes, see how to go from raw data to a boardroom-ready dashboard executives can act on immediately.
Zebra BI Live Product Demo
., . - . (.)
FREE
3.000+ companies growing with Zebra BI


You'll learn:
Why your data is ready but your reports still don't drive decisions and how to close that gap
Build a boardroom-ready sales dashboard live, in minutes, not hours of DAX
How Finance, Sales & Ops use Zebra BI to explain the "why" and not just report numbers
Generate a CEO-ready deck in one click with Zebra AI, across Power BI, Excel & PowerPoint
If you're looking for practical tips on how to stop staring at a blank page and start building truly insightful reports and dashboards - this session is for you.
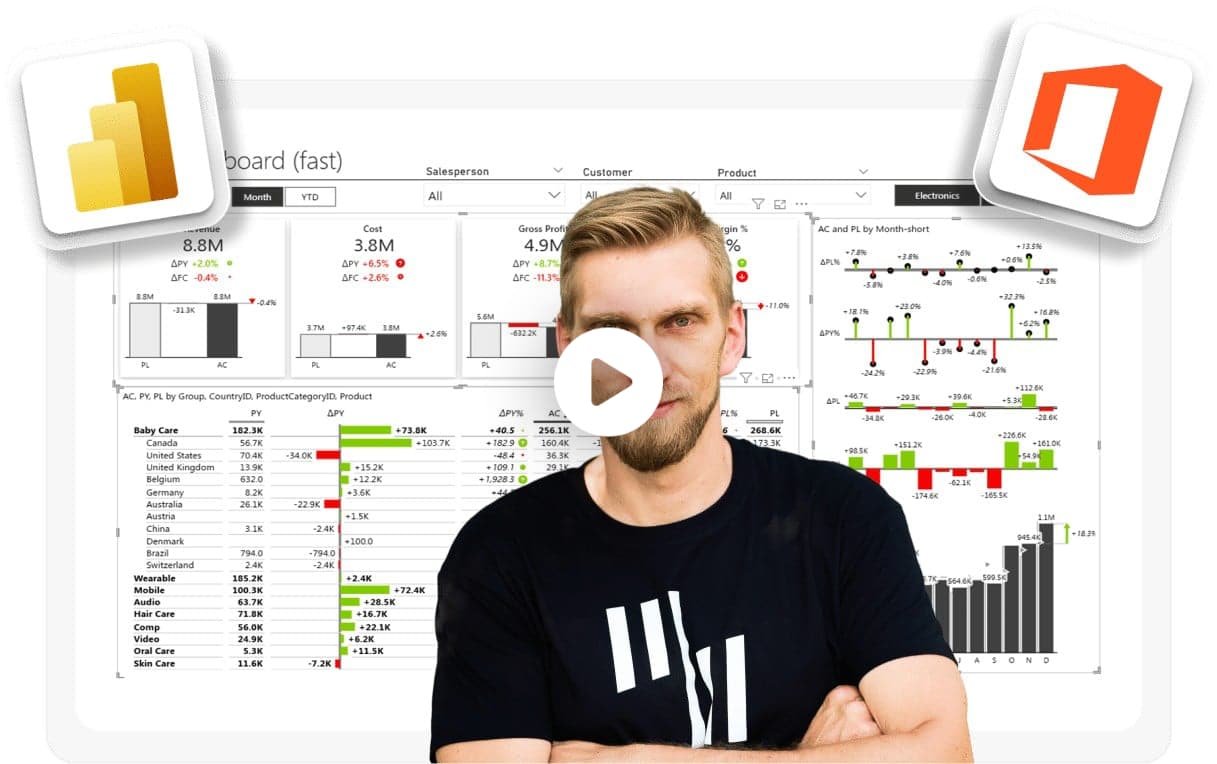
Join our BI expert Matija in a live demo where you'll learn how to create actionable reports from scratch. In just 45 minutes, we’ll walk you through the key features of our visuals, how to present your KPIs with clarity, and how to make better decisions with data - whether you’re using Power BI or Excel.
No need to schedule a call or dig through hours of content. Just join us live and see the power of Zebra BI in action. Stick around for a Q&A session at the end where we’ll answer all your questions!
Register for the event
., . - . (.)
Register
Zebra BI demos have been attended by 10,000+ visitors!
Microsoft certified

IBCS certified